In the realm of modern betting, self-monitoring dashboards have emerged as a pivotal tool for individuals seeking to maintain control over their gambling activities. These dashboards serve not merely as data displays, but as dynamic interfaces that empower bettors to understand their behavior, make informed decisions, and engage responsibly. By consolidating real-time information and historical data in an accessible format, self-monitoring dashboards create a comprehensive picture of a bettor’s patterns, tendencies, and potential risk areas.
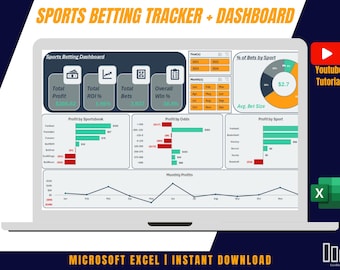
At the core of effective dashboards is clarity. Clear visualization of bets, outcomes, win-loss ratios, and expenditure allows users to see the immediate consequences of their actions. Simple charts, intuitive graphs, and color-coded indicators reduce cognitive load, helping bettors quickly comprehend complex data without feeling overwhelmed. For instance, a dashboard might use a gradient from green to red to represent spending levels relative to personal limits, instantly signaling when behavior approaches risk thresholds. This type of immediate feedback is crucial because it translates abstract numbers into meaningful signals that the user can act upon, reinforcing awareness and self-regulation.
Another critical element of self-monitoring dashboards is personalization. Each bettor has unique patterns, risk appetites, and behavioral tendencies. Dashboards that allow for customizable alerts, limit settings, and tailored metrics help users stay aligned with their individual goals. A bettor may set daily, weekly, or monthly expenditure limits, and the dashboard can track progress toward these thresholds in real time. Notifications or warnings generated when approaching these limits act as gentle but firm reminders, fostering responsible betting habits without imposing external judgments. This combination of control and autonomy is essential for engagement, as it encourages users to participate in monitoring actively rather than feeling constrained by prescriptive rules.
Historical tracking is another dimension where dashboards add value. By compiling and presenting past activity, bettors can identify trends and patterns that may not be obvious in the moment. For example, a user might discover that losses tend to accumulate during specific time periods or in particular types of bets. This awareness allows them to adjust strategies, reduce impulsive decisions, and allocate resources more thoughtfully. Furthermore, longitudinal analysis can highlight progress toward personal goals, such as maintaining losses within a pre-set limit or achieving consistent wins over time. Celebrating these small milestones through visual indicators or progress bars reinforces positive behavior and boosts user confidence in their self-management skills.
Self-monitoring dashboards also support financial literacy within the context of betting. By presenting detailed breakdowns of expenditure, winnings, and net balances, users gain a tangible understanding of how their money flows within the system. Some dashboards include comparative analytics, allowing bettors to see how their activity aligns with average patterns or risk profiles of similar users. This benchmarking can be a powerful motivator for reflection and adjustment. When users perceive that their spending exceeds typical norms or that risk levels are escalating, they can intervene early, preventing undesirable outcomes and promoting sustainable betting behavior.
Beyond financial data, effective dashboards often incorporate psychological and behavioral metrics. These may include indicators of betting frequency, session duration, and patterns of decision-making under varying conditions. By making these patterns visible, users can identify moments of emotional vulnerability or habitual overextension. For instance, a sudden spike in bets after consecutive losses might suggest chasing behavior, a common risk factor for problem gambling. Recognizing these patterns in a non-judgmental, data-driven format helps bettors develop strategies to pause, step back, or seek assistance if necessary, ultimately promoting healthier engagement with betting activities.
Interactivity is a hallmark of modern self-monitoring dashboards. Rather than being static displays, these systems allow users to manipulate data views, filter results, and drill down into specific metrics. This interactivity transforms raw data into actionable insights. Bettors can simulate scenarios, such as adjusting wager sizes or altering bet types, to understand potential outcomes and refine decision-making processes. Such interactive elements encourage deeper engagement with the dashboard, making it an educational tool as much as a monitoring system. Over time, users become more adept at interpreting patterns and predicting potential pitfalls, fostering a more disciplined approach to betting.
Integration with external systems is another feature that enhances dashboard utility. Linking accounts, syncing transaction data, or connecting with betting platforms ensures that all relevant information is aggregated in one location. This consolidation reduces the risk of oversight and enhances the accuracy of self-assessment. Additionally, some dashboards incorporate predictive analytics, leveraging historical data to project future outcomes and highlight potential risk zones. While predictions are never guarantees, they provide a valuable lens through which users can anticipate trends and adjust behavior proactively.
Importantly, the design of self-monitoring dashboards must balance comprehensiveness with simplicity. Overly complex interfaces risk overwhelming users, leading to disengagement or misinterpretation of data. Conversely, overly simplistic dashboards may fail to provide meaningful insights, limiting their effectiveness as behavioral tools. Optimal design emphasizes intuitive navigation, logical grouping of metrics, and consistent visual language. Color schemes, iconography, and layout choices all contribute to user comprehension, helping bettors process information efficiently and make informed decisions without unnecessary cognitive strain.
Ultimately, self-monitoring dashboards represent a convergence of technology, psychology, and responsible gaming practices. They empower bettors to take ownership of their behavior, offering transparency and actionable insights that support conscious decision-making. By highlighting patterns, signaling potential risks, and facilitating reflection, these dashboards transform the betting experience into one that prioritizes awareness, discipline, and sustainability. In doing so, they not only enhance the user experience but also contribute to a broader culture of responsible engagement, demonstrating that technology can play a critical role in fostering self-regulation and informed participation in betting activities.


Be First to Comment